The Drawing Center presents Sound Inscriptions on Fabric by Gabriel de la Mora

The Drawing Center presents a new solo exhibition by Mexican artist Gabriel de la Moura
July 13, 2016
The Drawing Center presents Sound Inscriptions on Fabric by Gabriel de la Mora

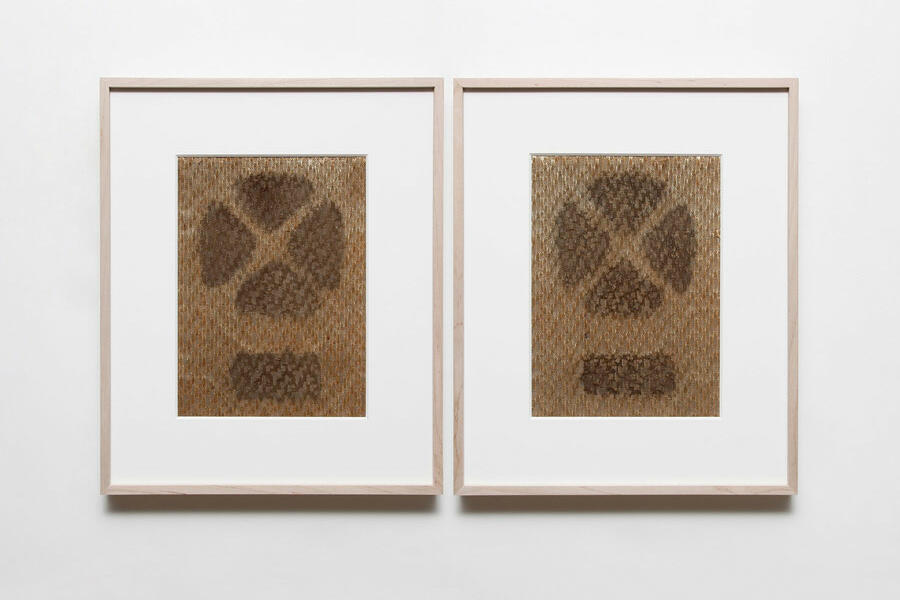
The Drawing Center presents Mexican artist Gabriel de la Mora’s exhibition Sound Inscriptions on Fabric, an installation of fifty-five pairs of found speaker screens, each of which carries the “drawn” imprint of dust generated by the sound of countless voices, songs, commercials, news broadcasts, and static that passed through the fabric screen during the speaker’s useful life. De la Mora, formerly an architect, is best known for constructing collections of found, discarded, and obsolete objects, such as eggshells and shoe soles, which he describes as caches for historical information about everyday life. Through a classificatory process, De la Mora deconstructs, photographs, and documents each object he accumulates. For his exhibition at The Drawing Center, De la Mora studied all of the fifty-five pairs of speaker grills with obsessive inquisitiveness to uncover the unique underlying architecture of each one. Sound Inscriptions on Fabric demonstrates De la Mora’s distinctive approach to drawing as durational and readymade rather than an act of immediate creation by the artist’s hand. This exhibition is curated by Brett Littman, Executive Director.

eZ debug

Timing: Feb 01 2026 12:16:16
Script start
Timing: Feb 01 2026 12:16:16
Module start 'content'
Timing: Feb 01 2026 12:16:16
Module end 'content'
Timing: Feb 01 2026 12:16:16
Script end

Main resources:

Total runtime0.0538 sec
Peak memory usage4,352.0000 KB
Database Queries71

Timing points:

CheckpointStart (sec)Duration (sec)Memory at start (KB)Memory used (KB)
Script start 0.00000.0059 911.8359607.5313
Module start 'content' 0.00590.0069 1,519.3672607.9609
Module end 'content' 0.01290.0409 2,127.32811,696.3516
Script end 0.0538  3,823.6797 

Time accumulators:

 Accumulator Duration (sec) Duration (%) Count Average (sec)
Ini load
Load cache0.00183.3667150.0001
Mysql Total
Database connection0.00081.490210.0008
Mysqli_queries0.013925.7813710.0002
Looping result0.00061.1845710.0000
TS translator
TS init0.00132.339030.0004
TS cache load0.00091.635130.0003
TS context load0.00081.406530.0003
Template Total0.040274.710.0402
Template load0.00091.759510.0009
Template processing0.039272.882210.0392
Template load and register function0.00010.141310.0001
Override
Cache load0.00050.940020.0003
Sytem overhead
Fetch class attribute name0.00081.438410.0008
Fetch class attribute can translate value0.00000.040810.0000
class_abstraction
Instantiating content class attribute0.00000.022110.0000
XML
Image XML parsing0.00132.471410.0013
states
state_id_array0.00091.663050.0002
state_identifier_array0.00101.825150.0002
General
dbfile0.00499.0515220.0002
String conversion0.00000.018620.0000
Note: percentages do not add up to 100% because some accumulators overlap

Time used to render debug report: 0.0003 secs