Martin Pelenur presents “Ballena” at Dodecá Cultural Center
Dodecá Cultural Center in Montevideo.

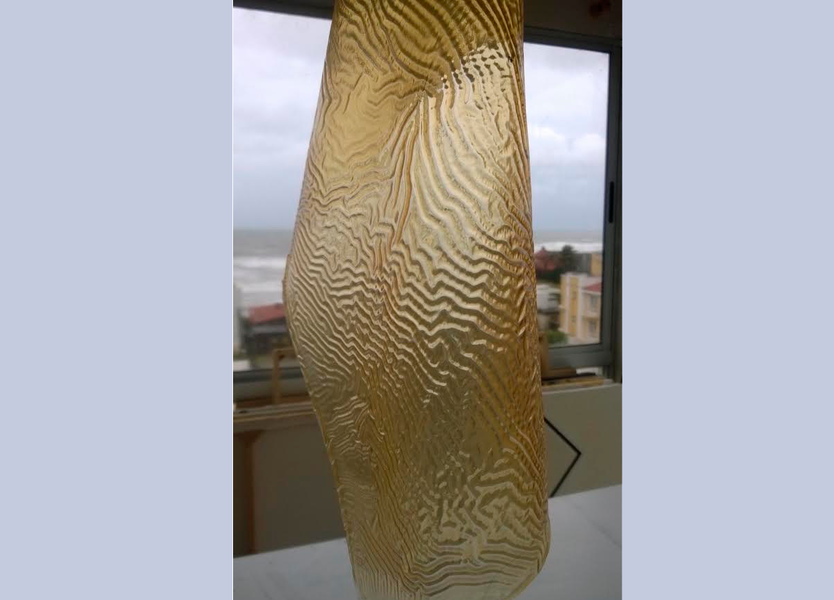
Martin Pelenur will open his new solo exhibition Ballena (Whale) at Dodecá Cultural Center in Montevideo. Curated by Martín Craciun the exhibition encompasses a new series of painting within a site specific installation. The intervention transforms the exhibition space into a machine to produce and display an exercise about repetition and time.
Martin Pelenur “Ballena”
www.martinpelenur.com
Openning 12th april 19hs. Open until June.
Centro Cultural Dodecá (www.dodeca.org)
San Nicolás 1306, Montevideo, Uruguay.
Curatioral Text
"Oh, my. So the whale swallowed all of you, too? My goodness. "
- Geppetto talking to Pinoccio
A sequence of industrial materials and processes are obsessively sorted. The idea that the experience of paying close attention may result in a pleasurable activity in any context is quite relative. The truth is that visual intelligence is very important in the time of accelerated circulation of images. Therefore deceleration, along with the slowdown in time and perception are key strategies to study things in detail. As enunciated by Gustave Flaubert, God is in the details - a world of original information, graphics and forms, of synchronicity, of veil and reveal arrhythmias.
Pelenur transform the exhibition space into a workshop, a lab. He creates a system of materials, forms and processes. Pelenur´s blue whale is time and form; is it possible to control the outcome on the basis of catalysis? how to become a dabbler of chemicals and repetitive processes, a master of failure and controlled indeterminacy?. Varnish is here a physical medium to mold and shape, a vehicle for content and ideas. The challenges of life in art as its content are introduced by the artist.
The exhibition is an exercise that intends to translate into the exhibition hall Pelenur´s universe, with its timeframes and temporalities. The installation is a machine for producing and thinking. His personal challenge is to generate sufficient and structural thickness - micron varnish, accumulated in countless layers resting for weeks erected in industrial elements.
Pelenur has been dedicated to develop a sustained experiment on painting. He constantly seeks to modify his approach, resisting the comfort of trends and maintaining the freshness of a practice that he is passionate. Every experience nourishes the next to generate inputs for his next move.


